Bento Ferreira - Vitória - Espírito Santo - Brazil
Cluster Analysis
Links and Download

Data Source: IBGE
This project analyzes the 78 municipalities of the State of Espírito Santo to determine the best approach for implementing service modules in three distinct sizes (Small, Medium, and Large). Using the K-means algorithm as the foundation for segmentation, the study combines statistical clustering techniques, hierarchical and non-hierarchical methods, to define clusters of municipalities with homogeneous characteristics.
The analysis considers various variables, such as population, population density, per capita GDP, number of agricultural establishments, and the Human Development Index (HDI). To adjust variable scales and ensure more precise clustering, data standardization was applied using the Standard Scaler method.
Additionally, the Elbow method was employed to determine the optimal number of clusters. Although the project specifies three fixed clusters, the application of the Elbow method reinforces the analysis of compactness and intracluster variation, ensuring greater reliability in the results.
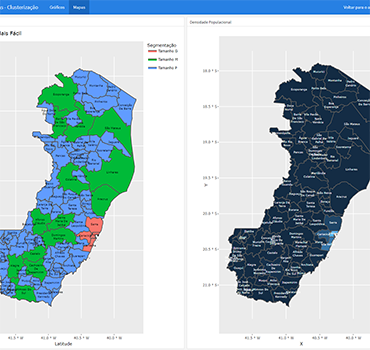
Developed dashboards allow visual exploration of the data and clusters. These include:
- Correlation charts between variables.
- Dendrograms for hierarchical visualization.
- Segmented maps based on module sizes and population density.
The study concludes that the use of K-means, combined with the Elbow method and data standardization, generates robust insights for resource allocation and governmental planning.
Focus on Algorithms and the Elbow Method
-
K-means Clustering:
- The main algorithm used to group municipalities.
- Divides data into three homogeneous clusters based on demographic and socioeconomic variables.
- Uses Euclidean distance to calculate proximities between municipalities and define cluster centroids.
-
Data Standardization:
- Applied to normalize variables and prevent scale discrepancies from affecting results.
- Used the Standard Scaler method to center the data around 0 with a standard deviation of 1.
-
Elbow Method:
- Identifies the optimal number of clusters by analyzing intracluster compactness (WSS - Within Sum of Squares).
- Determines the point at which adding more clusters does not significantly improve the explained variability.
- Although the project uses three fixed clusters, the method strengthens the segmentation's robustness.
-
Visualization and Interpretation:
- Dendrograms and WSS graphs illustrate cluster formation and compactness.
- Segmented maps provide a clear geographical representation of the defined groups.
Main features
Segments municipalities with K-means and the Elbow method, optimizing service allocation.
-
K-means for its simplicity and efficiency.
-
Standard Scaler for consistent feature scaling.
-
Elbow method for assessing cluster compactness.
-
Correlation matrices, and segmented maps.
-
Cluster-Based Segmentation
Groups municipalities using K-means to ensure tailored service module allocation based on data-driven clusters.
-
Interactive Dashboards
Features maps, dendrograms, and correlation charts to provide clear insights for decision-making.
-
Elbow-Driven Optimization
Validates cluster compactness with the Elbow method, ensuring accurate segmentation.
Technologies Used in This Project

Get in Touch with Me
Let's schedule a conversation so I can better understand your needs. Whether it's your data project or in-company training sessions, we will find the best solution. I would be happy to give you a call.
Agile is not a practice. It is an organizational and employee quality of being adaptable.
Craig Larman