Bento Ferreira - Vitória - Espírito Santo - Brazil
Vehicle Flow Dashboard
Links and Download

Data Source: ARSP - Agência de Regulação de Serviços Públicos do Espírito Santo
For decades, the ES-060, famously known as Rodovia do Sol, served as a vital connection between Vitória, the capital of Espírito Santo, and the southern parts of the state, passing through scenic coastal towns like Guarapari and Anchieta. Along this route, the iconic Terceira Ponte stood as both a gateway and a toll collection point, integral to the region’s infrastructure and development.
The toll system, initiated in the late 1980s, played a crucial role in funding the construction and maintenance of these roads. Operated by RodoSol under a 25-year concession starting in 1998, toll plazas at the Terceira Ponte and Village do Sol became central to sustaining the road network. However, this era came to a close in December 2023, when the concession ended, and the state government resumed control, signaling a new chapter in the road’s management.
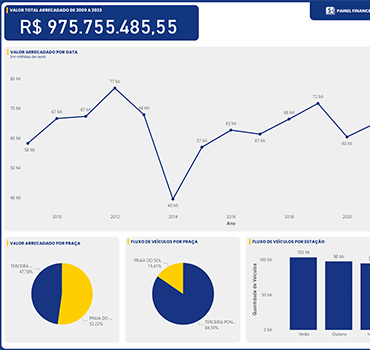
Amid this transition, the Vehicle Flow Dashboard was developed to provide data-driven insights into the decades-long toll operations. This dashboard consolidates historical data from two key plazas—Terceira Ponte and Guarapari—capturing the essence of their contribution to regional mobility. The process of creating the dashboard was no small feat, involving the integration of fragmented datasets, validation for accuracy, and advanced data modeling.
The result is an interactive, visually compelling tool that showcases vehicle traffic trends and revenue streams over the years, offering a retrospective of the toll system’s impact. Built with Python for data ingestion, R for validation, DBT for transformation, and Power BI for visualization, the dashboard is a testament to the intersection of infrastructure and technology.
Through this project, the legacy of the Rodovia do Sol and Terceira Ponte lives on—not just as physical connectors, but as data-driven stories that illuminate their role in shaping the region’s transportation history.
Main features
The project consolidates toll data with Python, validates it in R, transforms it via DBT, and visualizes insights in Power BI.
-
Visualizations built in Power BI
-
Data validation performed in R
-
Transformations handled with DBT
-
Integrated multi-year datasets
-
Data Integration
Efficient consolidation of multi-year toll data ensures structured and reliable datasets for analysis.
-
Data Validation
Data consistency and quality are validated using R, enabling accurate and actionable insights.
-
Advanced Visualization
Interactive dashboards in Power BI provide clear views of vehicle flow and revenue trends.
Technologies Used in This Project


Get in Touch with Me
Let's schedule a conversation so I can better understand your needs. Whether it's your data project or in-company training sessions, we will find the best solution. I would be happy to give you a call.
Agile is not a practice. It is an organizational and employee quality of being adaptable.
Craig Larman